valerieranaivo.github.io
Valérie Ranaivo
Data analyst
- Data cleaning
- Data processing
- Data exploration
- Data visualisation
- Data predictive modelling
- Data interpretation
About me
Turning raw data into insights and visualisations that help to uncover new learning is my passion, and what drives me forward!
I hold a Bachelor’s-level diploma in Data analytics from OpenClassrooms / the National Economics and Statistics School of France and I have several years experience supporting non-profit organisations in their decision processes.
This portfolio showcases a few projects I have worked on.
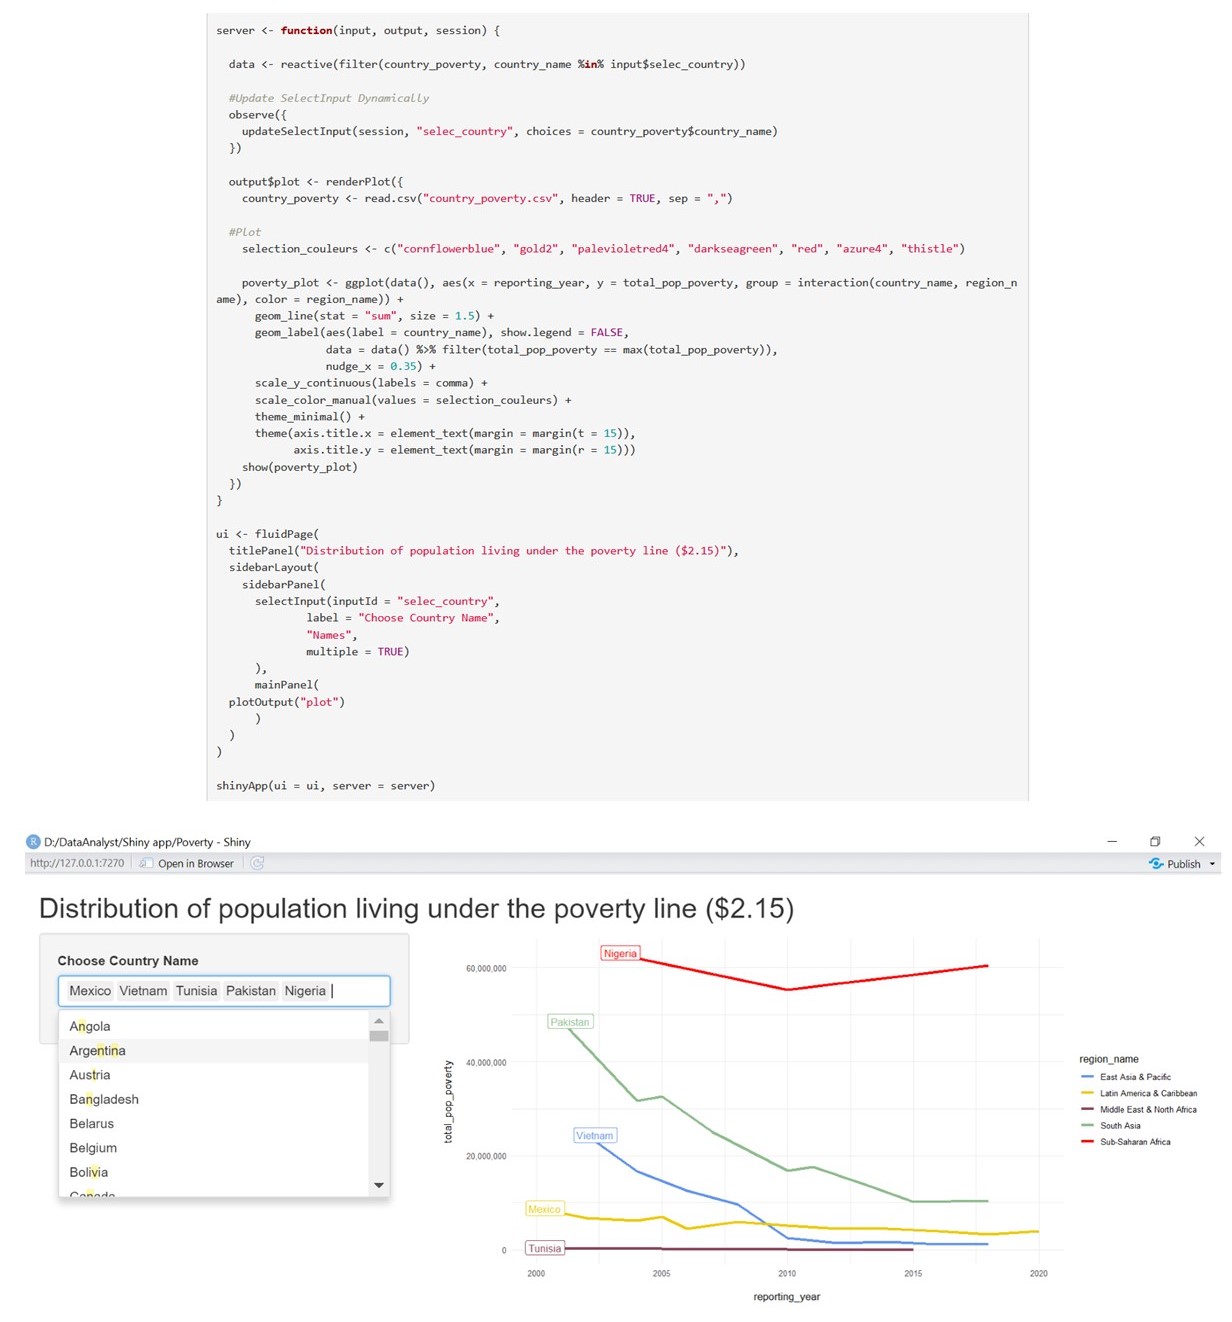
Poverty indicators - World Bank
Access to data: https://pip.worldbank.org/home
Description: This interactive dashboard provides a tool to visualise and compare populations in the world towards the $2.15 poverty line.
Technology: R, dplyr, ggplot2, shiny.
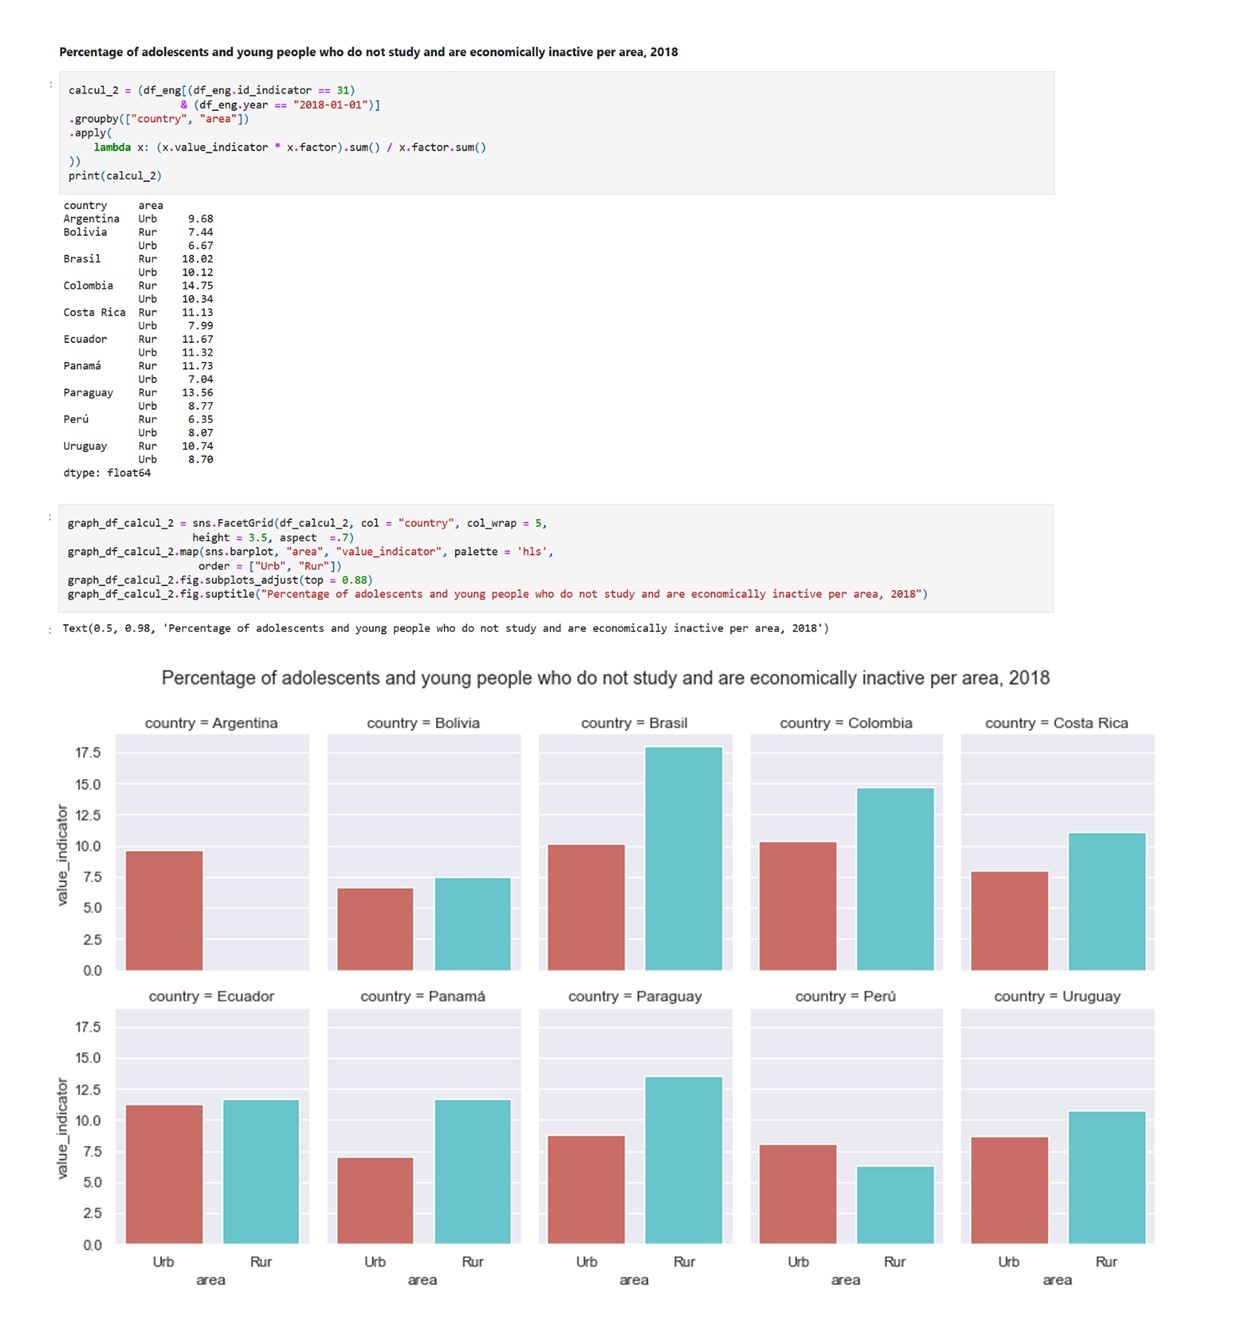
Education indicators - UNESCO
Access to data: https://github.com/iiepdev/HackingEDPlanningV2-Challenge6?utm_source=pocket_mylist
Description: This project, part of the Hacking EDplanning Hackathon organised by IIEP-UNESCO, aimed at improving educational indicators from Latin American countries disaggregated by socio-economic variables.
Technology: Python, Pandas, Numpy, Matplotlib, Seaborn.
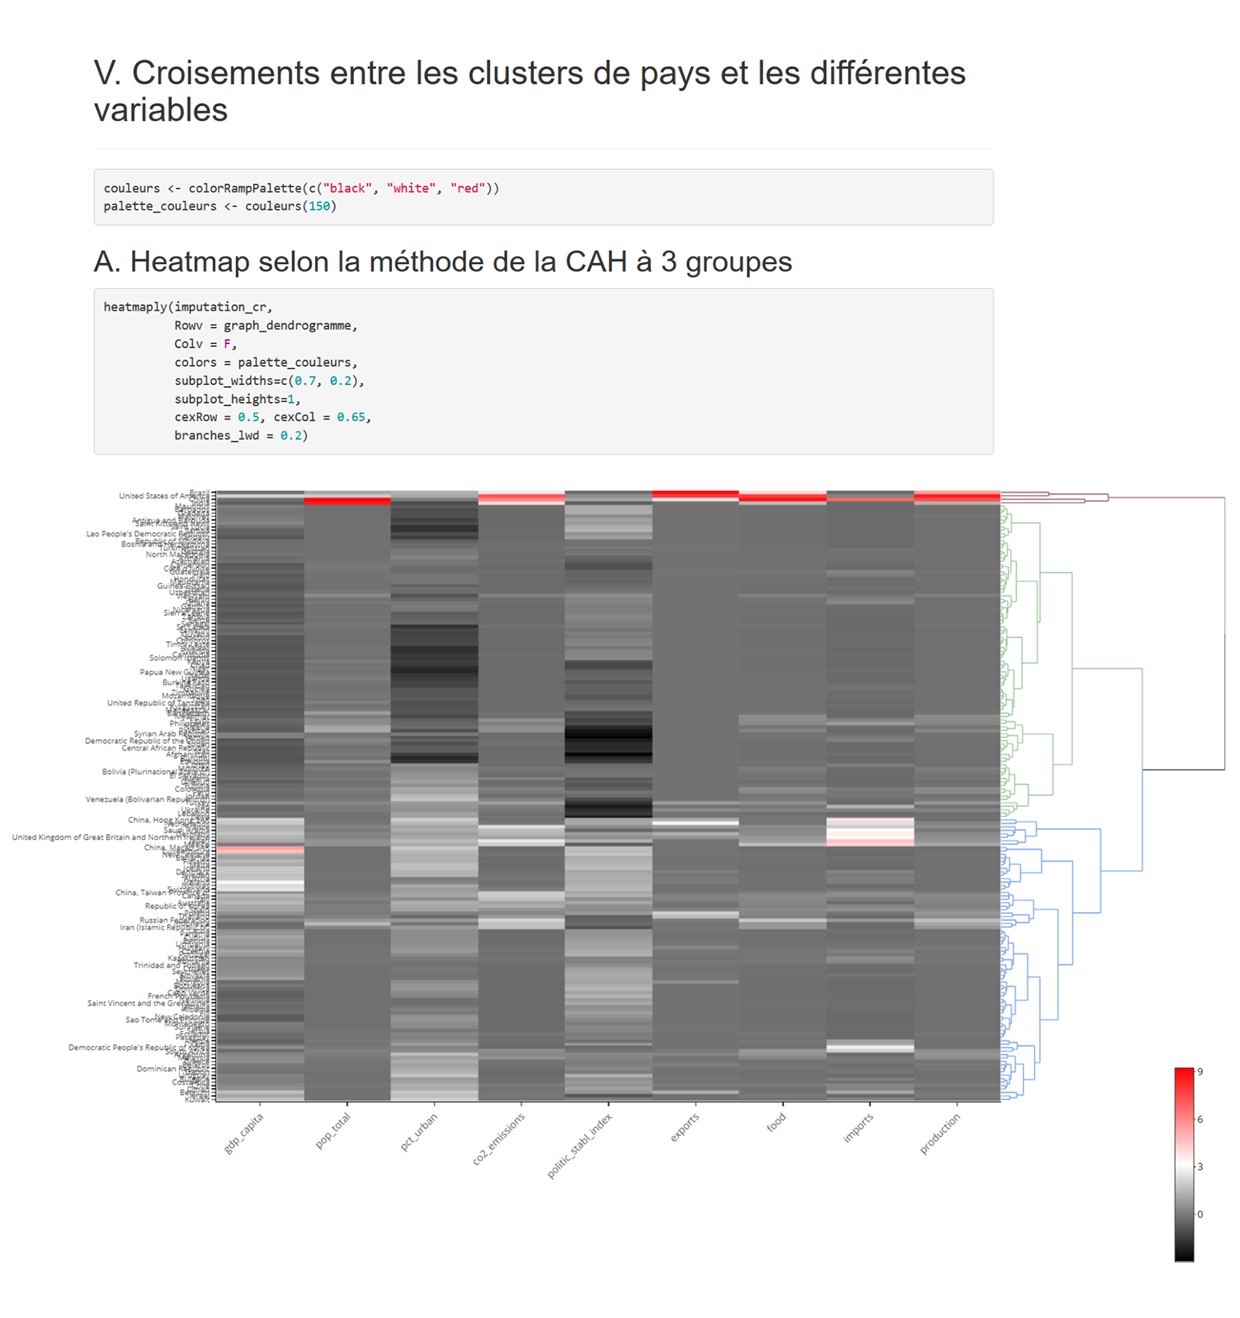
World poultry market analysis - FAO
Access to data: https://www.fao.org/faostat/en/#home | https://unstats.un.org/unsd/methodology/m49/overview/
Description: This project aimed to identify countries with the best export potential for poultry, using different clustering methods.
Technology: R, tidyverse, ggplot2, FactoMineR, factoextra, cluster, heatmaply.
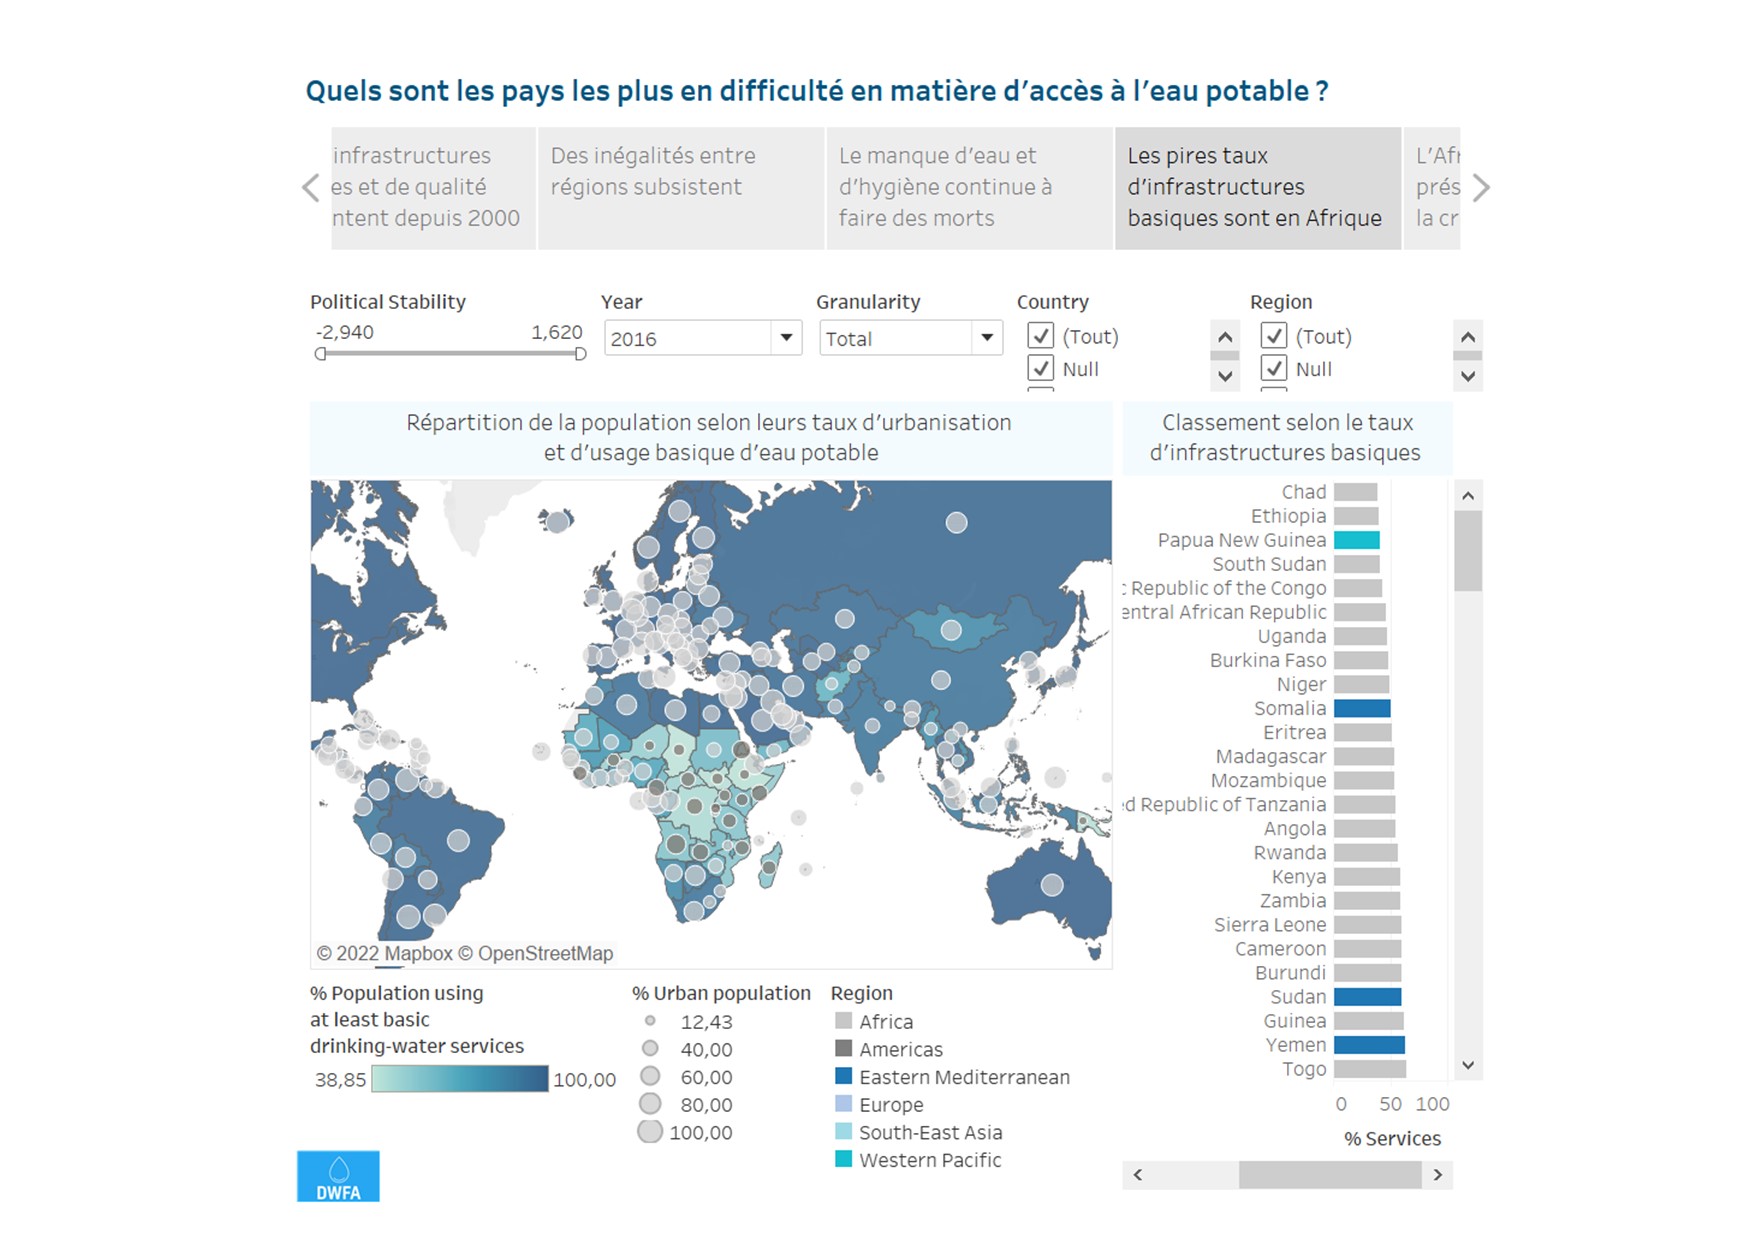
Water access in the world - WHO and FAO
Access to data: https://www.fao.org/faostat/en/#home | https://www.who.int/data/gho/data/indicators
Description: This data visualisation project highlights the countries most affected by lack of water through a story built from dashboards and worksheets.
Technology: Tableau, SQL.
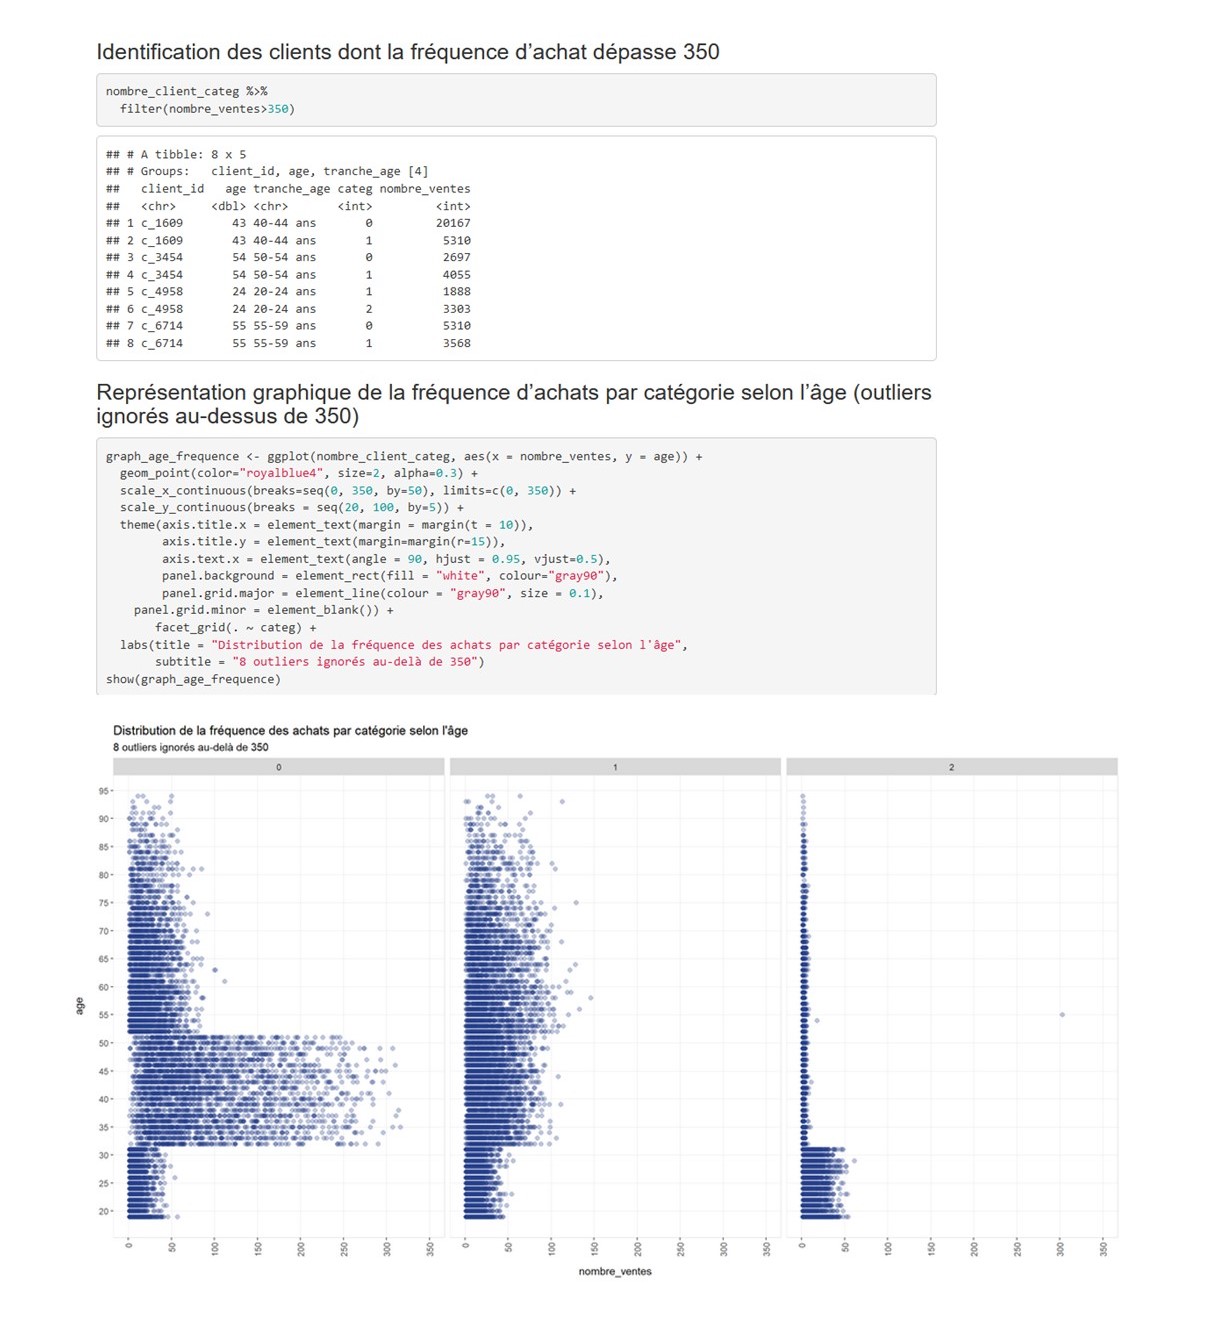
Sales analytics - Bookshop
Description: In this project, I measured KPIs to gauge sales performances and used inferential statistics to reveal correlations between different customer and product characteristics.
Technology: R, tidyverse, ggplot2, lubridate.
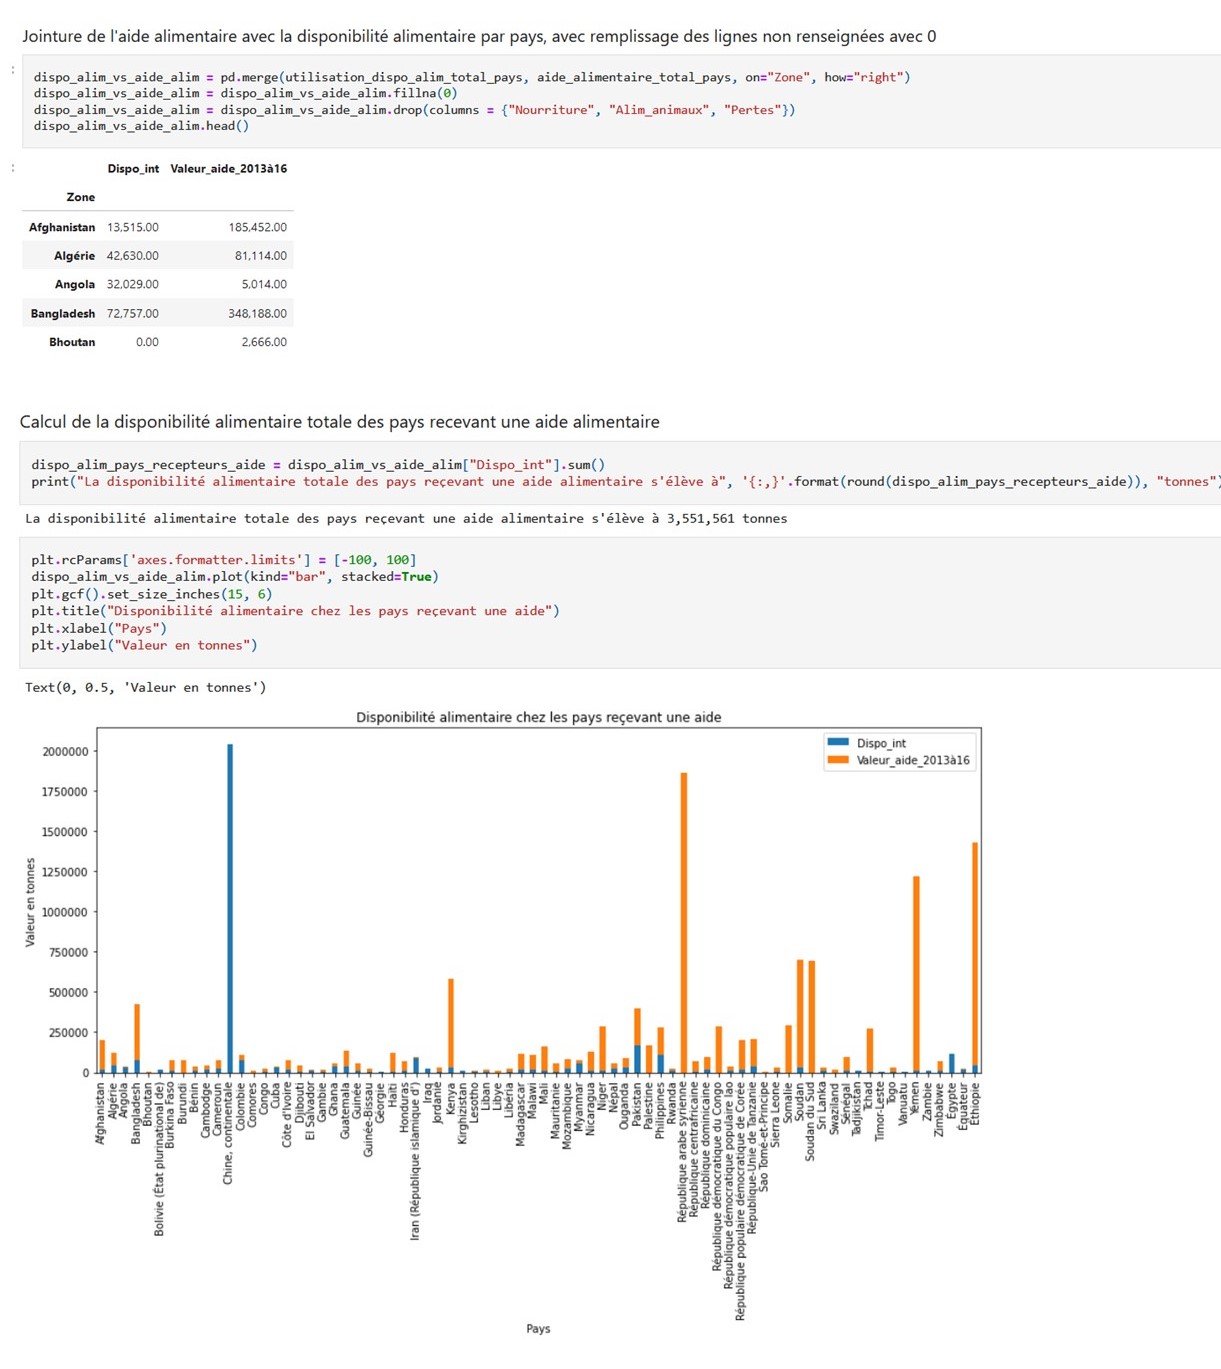
Overview of undernourishment - FAO data
Access to data: https://www.fao.org/faostat/en/#home
Description: This descriptive analysis uses data from 2017 on total population and population affected by undernourishment, as well as food availability and food aid values.
Technology: Python, Pandas, Numpy, Matplotlib.